High Injury Network

What is a High Injury Network?

The High Injury Network (HIN) is a subset of streets in the city where the majority of serious inury and fatal crashes occur. It was developed using GIS mapping and a manual review. Crash data from PennDOT was mapped onto the city’s roadway network and queried to identify a subset of streets with the highest number of crashes within 20 feet. The manual review of the query results checked for gaps and extended some segments to include serious and fatal crashes at nearby intersections. The results were vetted by city staff and members of the Steering Committee.

Lancaster’s HIN contains some or all segments of 19 different streets. Lancaster’s HIN and HINs in other cities exhibit similar characteristics. These include:
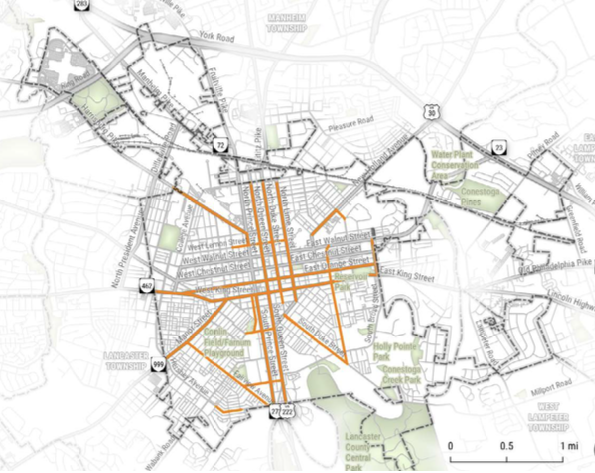
Lancaster's High Injury NetworkLancaster's High Injury Network

A relatively small percentage of cities’ street networks account for a disproportionately high proportion of traffic deaths and serious injuries.

  • The Lancaster HIN is only 6 percent of the streets in the city but have 77 percent of the serious and fatal crashes (56/73).
  • The HIN is also the location of 66 percent of all bicycle and pedestrian crashes regardless of severity level (272/420).

Many of the streets in the HIN are arterials, or streets that carry higher volumes of vehicles at higher speeds.

  • The streets on Lancaster’s HIN are categorized mostly as major and minor arterials, with a few major collectors – generally the widest and fastest streets in the city.
  • In Lancaster, 95 percent of the streets in the HIN are state routes. Permanent changes on these roadways will require close coordination with PennDOT.
  • Approximately 9 miles, or 60 percent of the HIN are one-way streets with more than one travel lane.

Many HIN streets are located in low-income communities, communities of color, and/or communities with low car ownership.

  • Using the Focus Areas developed in the Active Transportation Plan, the top quintile focus area is 14 percent of the city’s land area but is the location of 26 percent of the serious and fatal crashes (19/73).
  • This area also has 28 percent of all bicycle and pedestrian crashes (117/420).
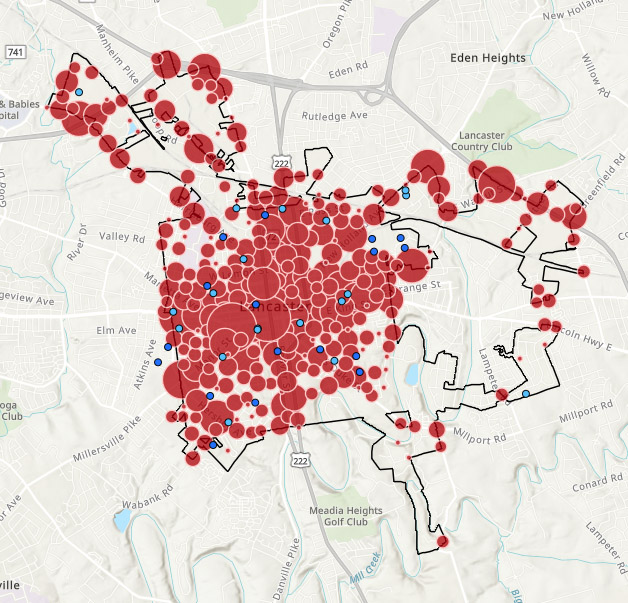
Crash Data DashboardCrash Data Dashboard

Crash Data Dashboard

This interactive tool allows the user to view traffic crashes that occurred in the past on the streets of Lancaster. The user can search by crash year or a series of years, and whether the crash occurred at an intersection or along a block. Additional data includes the number of serious injury and fatal crashes (KSI) by year, month, day and hour; and the severity of crashes, type of crash, mode of transit, and vulnerable user.

Crash Data Dashboard